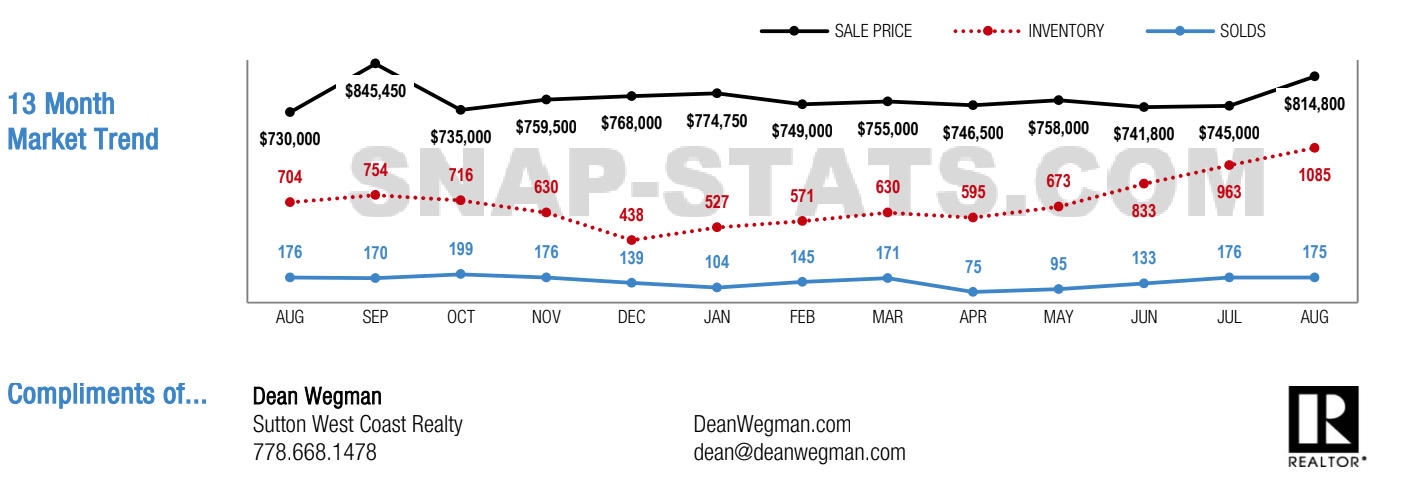
Current trends have all neighbourhoods, downtown, West End, Yaletown, and Coal Harbour in “balanced” market conditions. When compared to July inventory rose by 13%, sales decreased by 1%, and sale prices rose by 9%. Coal Harbour which had been in a buyer’s market for a prolonged period of time saw demand return.
Neighbourhood Breakdown For August
The BIGGER picture
The overall list to sales ratio for ALL of Vancouver downtown was 16% in August (down from 18% in July).
Here’s the breakdown for Vancouver Downtown condos and townhomes in August:

Thinking of buying or selling a downtown condo? We're here to help! Contact us to find out why we sell the most.
All stats derived from Dean Wegman & SnapStats.
Neighbourhood Breakdown For August
- Downtown 15% with 408 listings and 61 sales
- Westend 17% with 235 listings and 40 sales
- Yaletown 17% with 301 listings and 50 sales
- Coal Harbour 17% with 141 listings and 24 sales
The BIGGER picture
The overall list to sales ratio for ALL of Vancouver downtown was 16% in August (down from 18% in July).
Here’s the breakdown for Vancouver Downtown condos and townhomes in August:
- The most active price range was for homes between $500K to $600K & $800K to $900K (average 30% sales to list ratio)
- Homes are selling on average at 100% of list price
- Buyer’s Best Bet: Homes $5 mil plus, Downtown, and up to 3 bedroom properties
- Seller’s Best Bet: Selling Homes in the Coal Harbour, Westend, Yaletown, and up to 1 bedroom properties.

Thinking of buying or selling a downtown condo? We're here to help! Contact us to find out why we sell the most.
All stats derived from Dean Wegman & SnapStats.